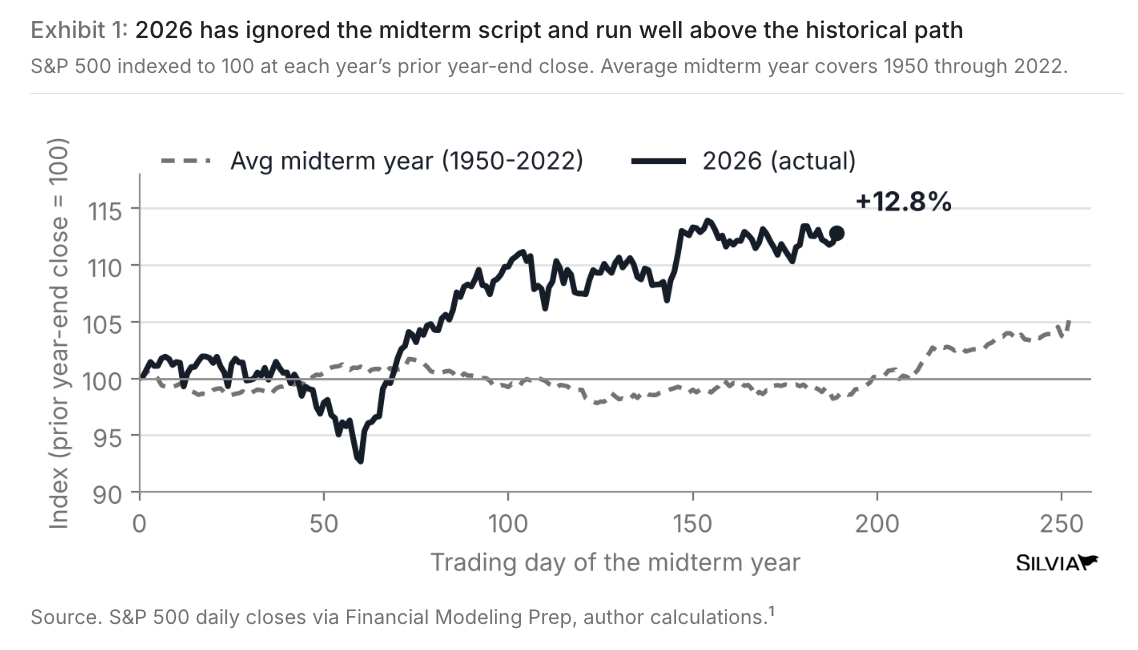
The chart of the week shows that the S&P 500 has performed much better in 2026 than it typically does during a midterm election year. The average midterm-year pattern from 1950–2022, shown by the dashed line, was relatively flat into October and even declined during parts of the year. In contrast, the 2026 stock market fell early in the year but then recovered strongly and is up about 12.8% as of October 5th. This means that 2026 has ignored the historical midterm pattern and followed a much stronger path. Midterm years can be different for the stock market and the economy because stock prices reflect investors’ expectations about future growth, profits, interest rates, AND expectations for changing political conditions rather than simply the economy’s current performance. Overall, the historical tendency for midterm years to experience more uncertainty and weaker market performance has not held true so far in 2026.