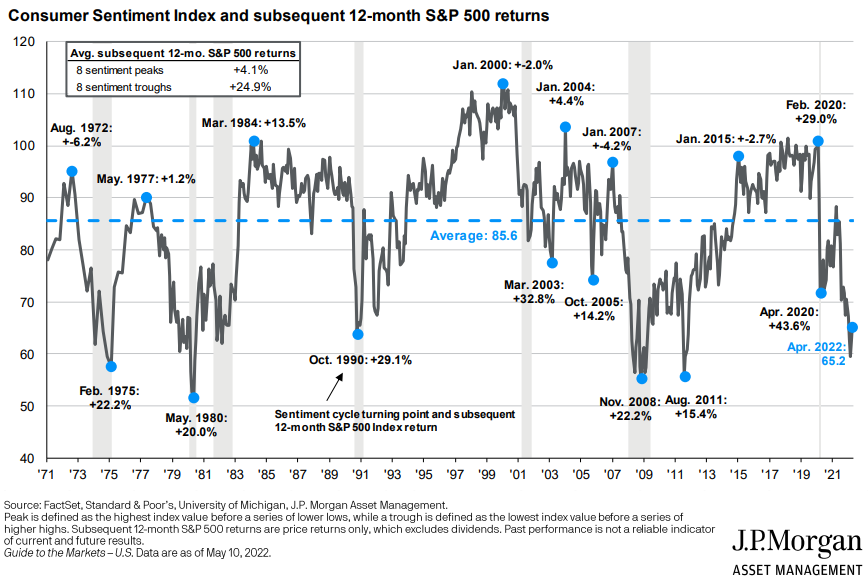
The chart of the week looks at the University of Michigan’s consumer sentiment index and subsequent returns. Per the name, the consumer sentiment index tries to capture how consumers feel about their finances and their view of economic conditions. This chart specifically looks at peaks and troughs through the last 50 years and subsequent returns of the S&P 500 index. The average 1 year return following the last 8 sentiment troughs was 24.9%. Time will tell if we are near another trough or not.