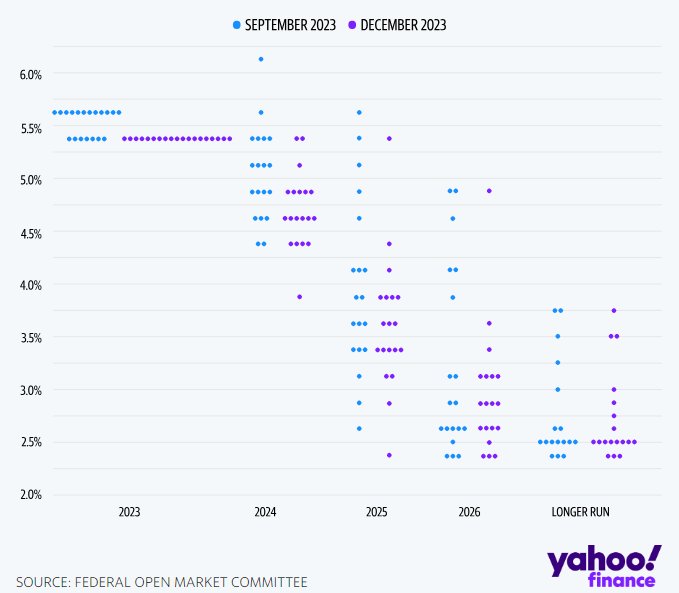
The chart of the week is the latest Dot Plot from the Federal Reserve and also includes their last plot from September. As we can see in the charts and as we saw in the markets recently, the Fed has signaled an end to rate hikes in this cycle and 0.75% of rate cuts in 2024. Comparatively, across 2024, 2025, and 2026, the anticipated rates are notably lower than those forecasted in September, although the “longer term” outlook remains relatively stable. Recent fluctuations in interest rates have been substantial, prompting curiosity about how rates will respond in 2024. Will we witness rate cuts due to an economic slowdown? Or perhaps as a result of further moderation in inflation. Or will things change like they always do and rate cuts aren’t as soon as we expect…