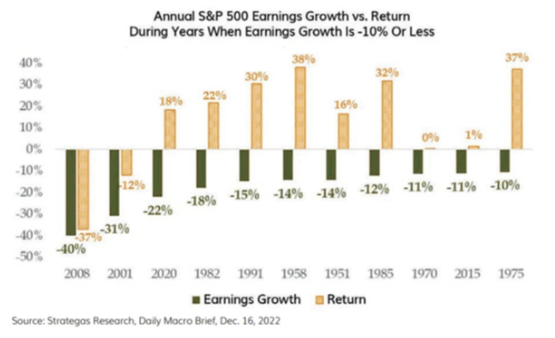
The chart of the week looks at calendar years where earnings were down 10% or more and the related returns for the S&P 500. Of the 11 years on the chart, the S&P 500 was only negative in two of those years and was flat in one year. Long-term earnings are a key driver of investment performance, but what the chart shows is that with shorter-term, this is not always the case. This is likely because the market is forward-looking and is not as focused on current earnings as they are on future earnings.