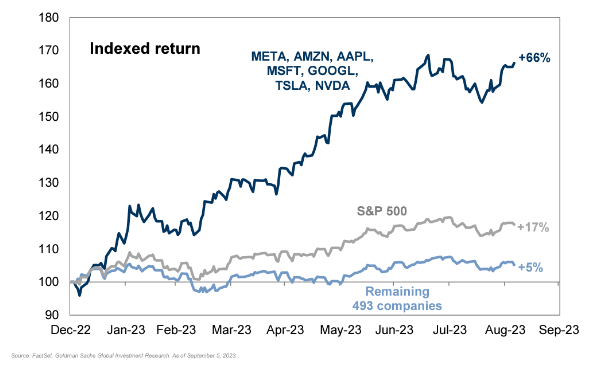
The chart of the week looks at year-to-date returns of the S&P 500 and then breaks it down into two subsets. Year-to-date, the S&P 500 is up about 17%, but when you break it down, how that return has been achieved may be surprising. The “magnificent 7” as some have called them are up on average 66% this year, as opposed to the other 493 companies being up only 5% on average. While 17% feels great, more breadth in market returns would make us feel more confident in the market.