Relatable Finance chart of the week 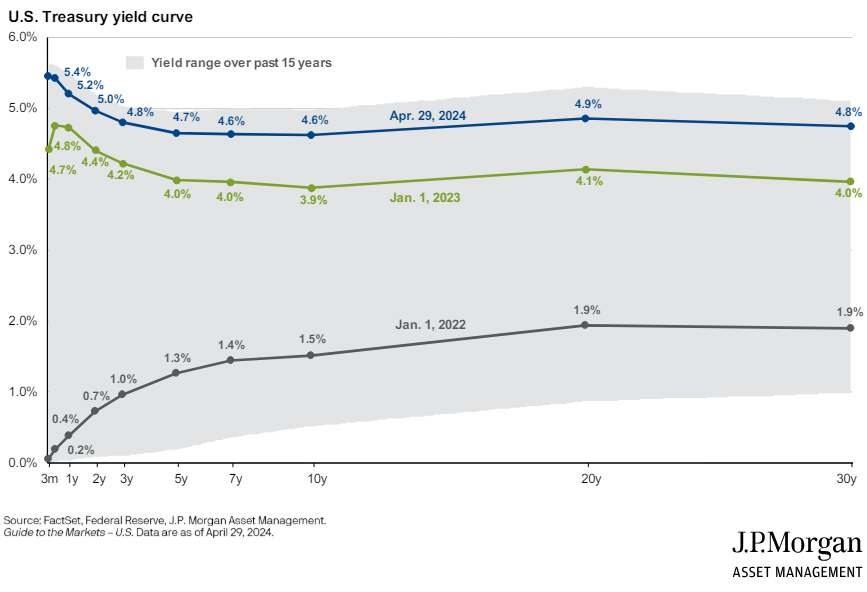 The chart of the week focuses on the Treasury yield curve, ranging from 3 months to 30 years. Currently, the yield curve is both inverted, meaning short-term rates are higher than long-term rates, and very flat, with very little difference in rates from 3 years to 30 years. If the Federal Reserve implements rate cuts in the future, short-term rates would be expected to drop. For instance, from 5.4% to 5.15% with a 0.25% cut, and potentially fall even further with additional cuts. The question on everyone’s mind is when will the rate cuts begin, how many will be made, and whether it will be too late to secure longer-term yields.