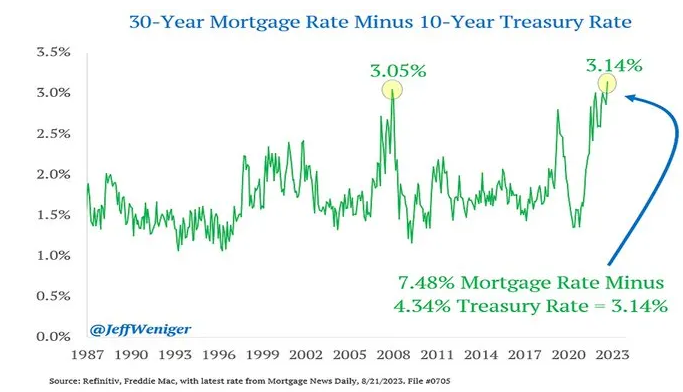
The chart of the week looks at the difference between a 30-year mortgage and the 10-year US Treasury yield, which has hit the maximum difference since 1987. While it makes sense that as rates go up, mortgage rates go up as well, what has seen the most increase has been the front-end of the yield curve which is short-term rates. Since the end of 2021, 3-month Treasuries have increased well over 5% while the 10-year Treasury has only increased from about 1.5% to about 4.3%. Recently, we have seen the 10-year Treasury move higher, increasing from about 3.3% in April 2023 to the current levels. Just another way of looking at the extreme interest rate environment and changes we have seen over the last 18 months.