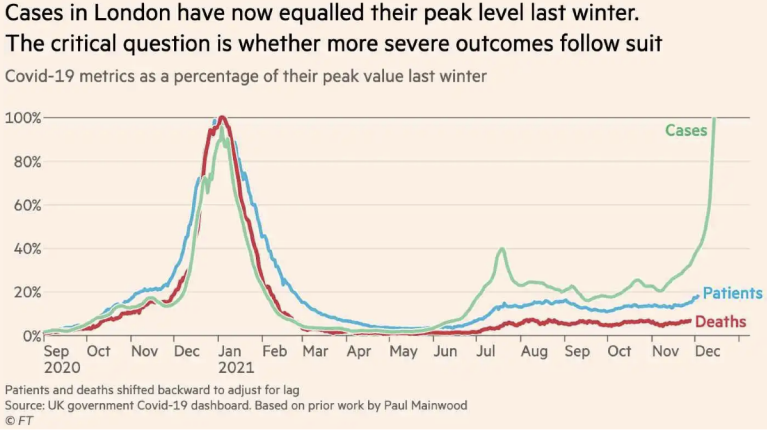
The chart of the week looks at three COVID metrics for London: cases, patients and deaths. All three are measured according to their peak levels, which all three hit right around the end of 2020/beginning of 2021. Fast forward to today and you see cases have once again hit their high. The question moving forward is whether the number of patients and deaths will remain lower or increase similar to what we saw at the end of last year. You can also see how much higher cases have been this time around than what we saw in July with the Delta variant. The US virus rates have followed London by about 2-4 weeks during prior outbreaks. The severity of this outbreak will have a big effect on the economy and the markets as we move closer to 2022.