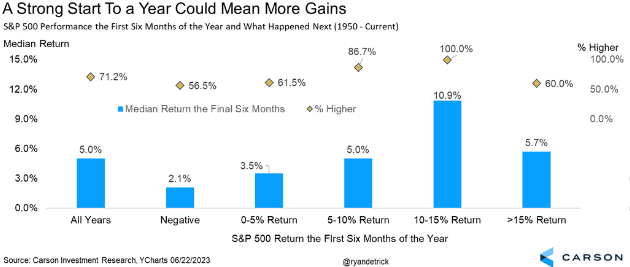
The chart of the week looks at the average performance of the S&P 500 in the second half of the year based upon how it performed in the first six months since 1950. When the market was negative to start the year, it gained 2.1% in the second half of the year. When the market returned 0-5%, it was up 3.5%. The S&P 500 has started very well in 2023 and at the halfway point will likely fall in the 10-15% range, which historically has returned the highest percentage in the second 6 months. The most important part of the whole chart is that the average performance in the second half of the year is 5%, no matter what happened in the first six months.