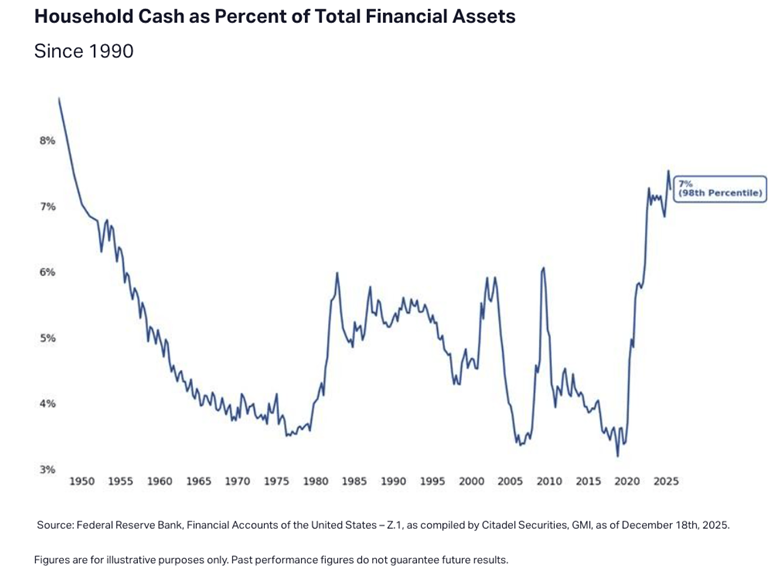
The chart of the week examines household cash as a share of financial assets, which is heavily influenced by interest rates and cash yields. Cash levels declined from the 1950s through the 1970s as rates were low but then rose into the 1980s as interest rates peaked. Leading up to 2020, cash fell to relatively low levels amid low rates and strong risk appetite for other market investments. When the pandemic hit, households sought liquidity and benefited from stimulus, along with an uptick in interest rates due to stimulus measures. Even with additional Fed rate cuts in 2025, cash remains elevated near 7% of assets, around the 98th percentile historically, raising the question of how much may shift into other investments if cash yields continue to fall with further rate cuts in 2026.