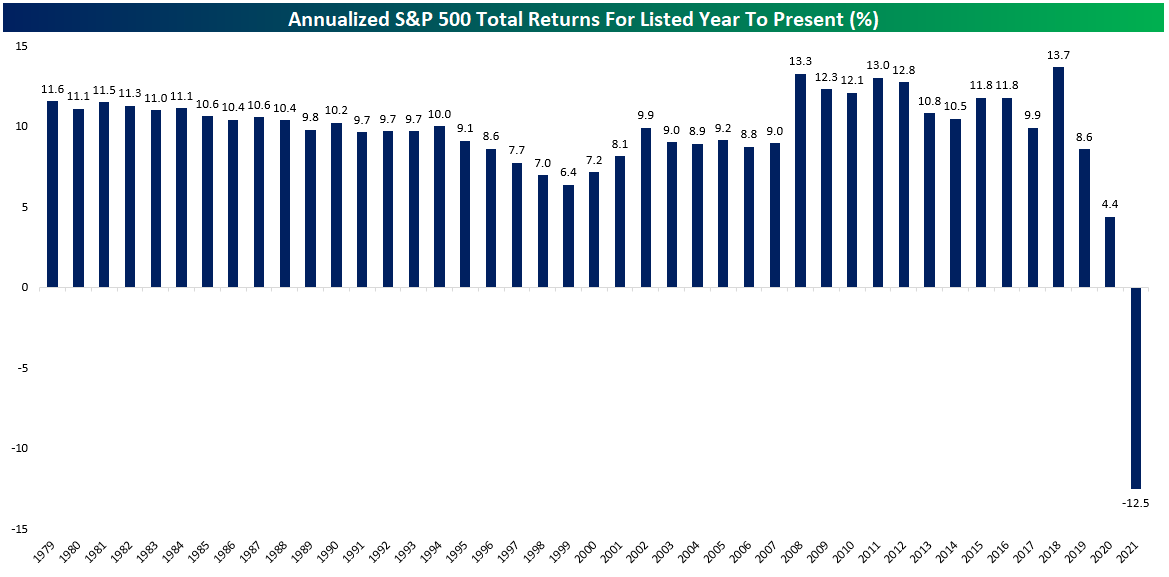
The chart of the week looks at the annualized returns for investments in the stock market if you purchased on the last day of each year as of March 8th, 2023. For instance, if you invested in the S&P 500 on the last day of 1999, you made 6.4% a year or 13.3% a year if you invested at the end of 2008 during the Financial Crisis. What should jump off the screen when looking at this chart is that if you invested during any of the last 42 years except for the end of 2021, you have enjoyed a positive return. If we were looking 42 years into the future, a fair prediction would be that we will see a similar pattern. So, if you are new to the market, patience is key.
Source: Bespoke Investment Group
The S&P 500 represents approximately 75% of the investable U.S. equity market. Indices are not available for direct investment. Any investor who attempts to mimic the performance of an index would incur fees and expenses which would reduce returns.