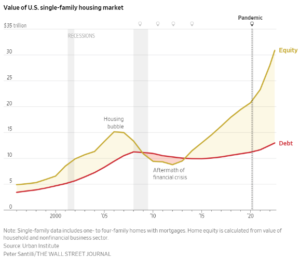
The chart of the week looks at home equity versus debt over the last 25 years. You can see the housing bubble prior to 2008 created a large margin of equity versus debt, but then coming out of the Financial Crisis, many home owners were under water. Home prices have since soared, helped by demand during 2020 and 2021, largely due to COVID-19. Home equity is now currently more than twice home debt overall. With the large increase in interest rates, home prices are likely to slow their growth and even come down moving forward. This shouldn’t be a problem for most, due to the built up equity in their homes.