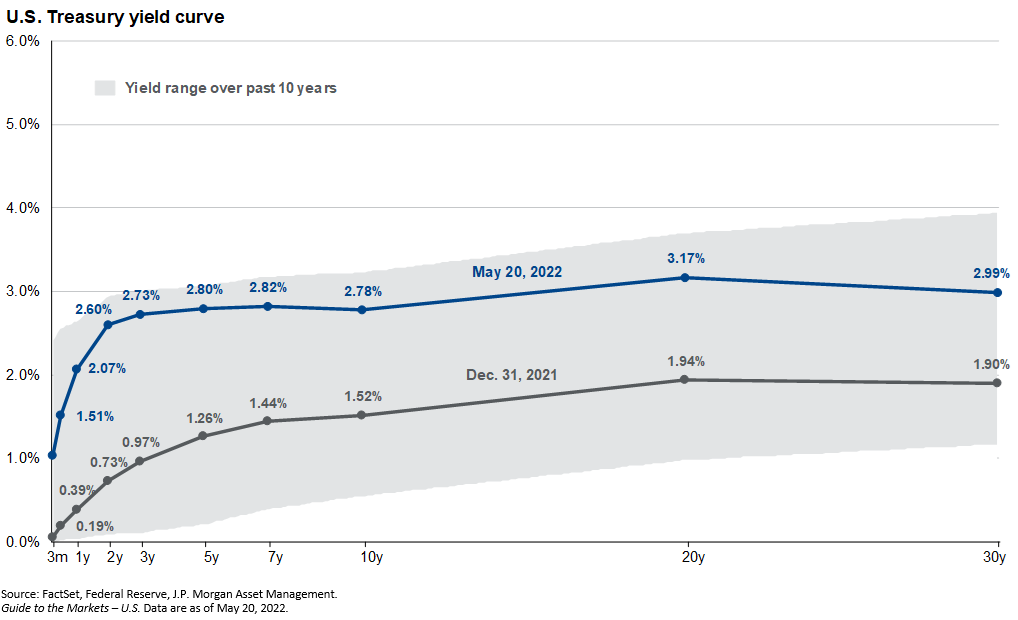
The chart of the week looks at the Treasury yield curve with maturities from 3 months out to 30 years. The blue line depicts rates as of May 20, the grey line as of year-end 2021 and the grey shaded area is the range over the last 10 years. A couple of points to note: first, looking at the shaded 10-year range, you can see how close we are to the top of the range currently, especially on the 3 month to 5-year range. Second, although rates have increased substantially across the board, shorter-term rates have increased at a higher percentage than long-term rates. The 2-year rate has increased from 0.73% to 2.6%, an increase of over 250%. Meanwhile the 10-year has increased from 1.52% to 2.78%, an increase of over 80%. The future of this yield curve should have a lot to say about the future of investment assets. Will yields stabilize? Is further increases on the horizon? Or have interest rates overshot and will they come down again?