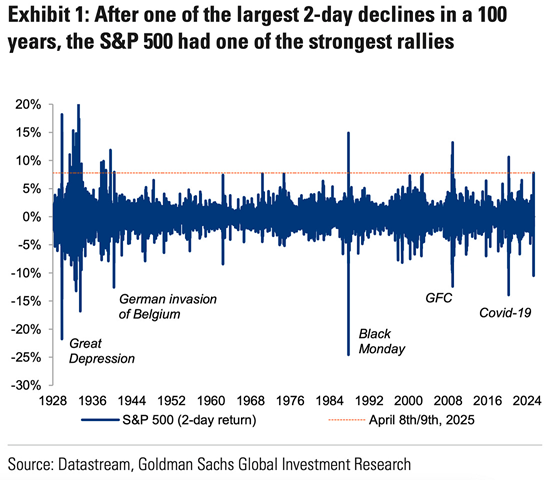
This week’s chart illustrates historical two-day returns in the S&P 500, emphasizing how extreme market moves frequently occur in close proximity. The data reveals that volatility tends to cluster, with sharp declines often followed by equally sharp rebounds. Notably, we see a striking symmetry around the x-axis, reinforcing the importance of staying invested during periods of heightened volatility. Missing these rebound days can significantly impact long-term returns, underscoring the value of a disciplined investment approach to dissuade short-term, emotion-driven investment decisions.