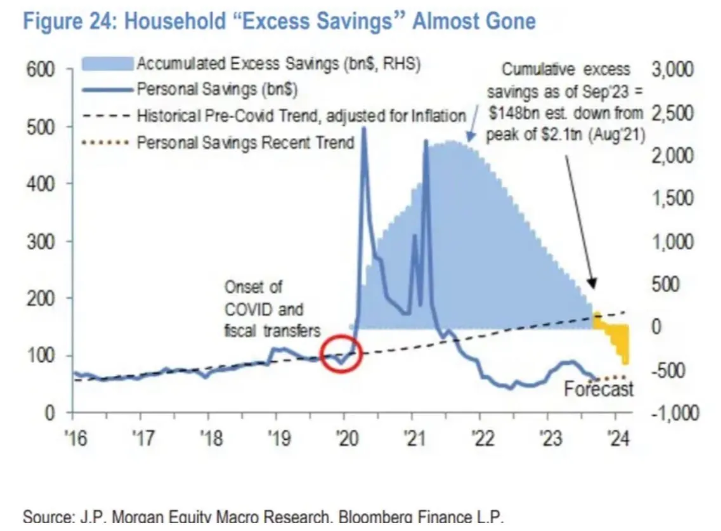
The chart of the week looks at excess saving by consumers during the pandemic years estimated at around $2.1T. After this peaked in August 2021, much of these savings have been spent down and the savings are now closer to $158 billion. This has led to an increase in debt as well, as many people continue to spend even though they have run out of those savings. The strength of the consumer is a key factor in GDP growth and consumer saving rates and amounts are a focus we will continue to monitor.