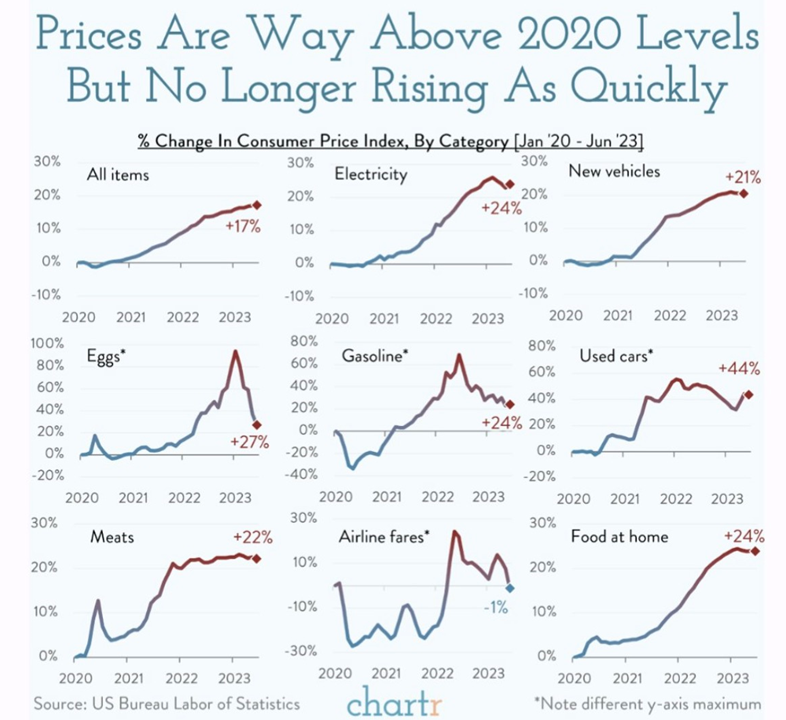
The chart of the week looks at inflation or the Consumer Price Index (CPI). We have discussed CPI many times, but this chart specifically looks at the change from January 2020, before the COVID-19 pandemic to June 2023. Most prices are well above their pre-pandemic levels, but what is interesting for a lot of the different categories is they have already hit their peak prices and have now come down. The price of eggs is a perfect example. After spiking into late last year, the price has come down, which we all have likely seen at the grocery store. Gasoline and airlines fares followed a similar pattern. The most interesting takeaway is that airline fares in general are actually back below pre-pandemic levels after that initial drop and then resurgence during 2021-2022.