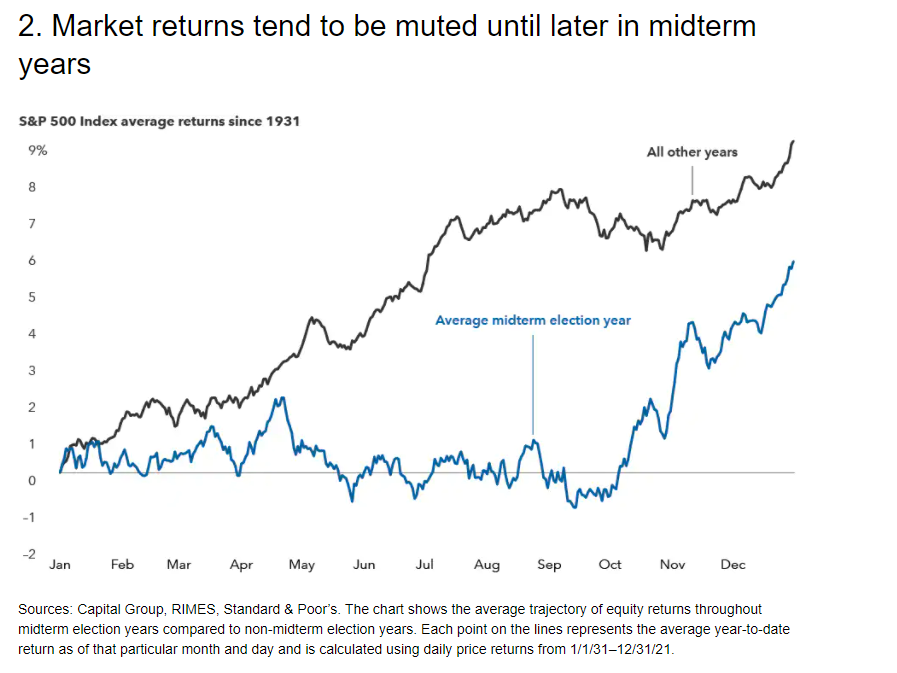
The new year has started off with volatile markets. While a primary driver of that has been the Fed’s announcement that they expect to raise interest rates 3 times this year, as well as higher inflationary readings, we should remind ourselves that we are in a mid-term election year. This week’s chart compares S&P 500 returns during a mid-term election year versus all other years. From a historical viewpoint, the S&P 500 tends to tread water until around September or October, and then moves higher once we have a better idea of how mid-term elections will unfold, and policy out of Washington shaped.
Source: Capital Group