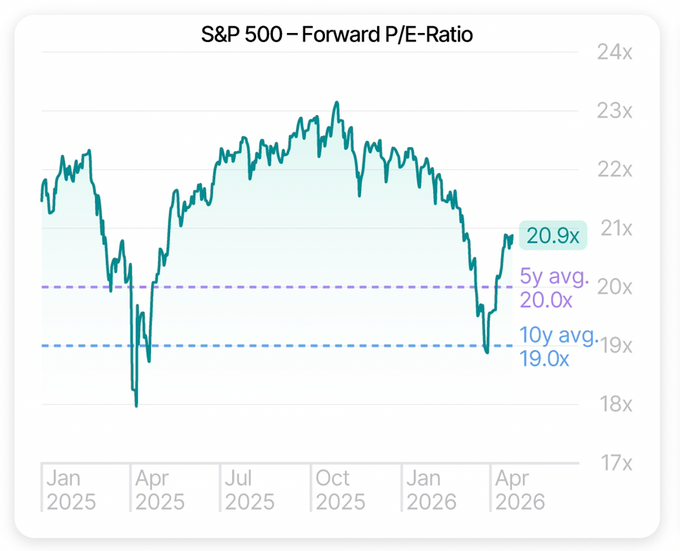
 The chart of the week highlights the S&P 500 forward P/E ratio, tracking its movement from early 2025 through early 2026. The ratio shows meaningful swings over the period, with sharp declines during the tariff-related selloff in early 2025 and again in early 2026 when the Iran conflict began. In both instances, valuations dipped below the 5-year average of 20.0x and the 10-year average of 19.0x. Following the most recent market recovery, the forward P/E has climbed back to roughly 20.9x. However, a key question remains: why hasn’t it returned to the higher levels above 22x, or even the prior peak near 23x? The answer lies in the strength of corporate earnings over the past five quarters. While headlines have focused on tariffs, government shutdown risks, and geopolitical tensions including Iran, the quieter and more persistent force shaping the market has been strong profitability. As a result, even though stock prices have rebounded, earnings have risen alongside them. When earnings increase faster or in tandem with prices, valuation multiples naturally compress. This dynamic has helped keep P/E ratios from returning to prior highs and has instead brought them back to more reasonable, attractive levels despite the recovery in equity prices.