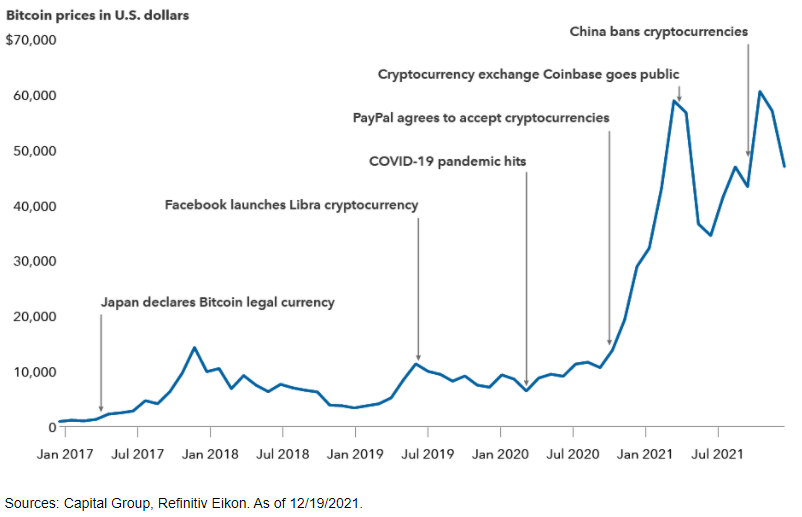
The chart of the week shows the price movements of Bitcoin since the start of 2017 along with some major events that have occurred along the way. There are three things that stick out when studying the chart. The rulings of individual countries could have been major turning points in the price of Bitcoin (Japan, China) and how governments handle cryptocurrencies in the future will likely continue to be a major influence. How companies use or do not use, or rather the future acceptance of, cryptocurrencies will likely have a large influence on the price moving forward. And lastly, notice the large price jumps and large price declines all of which occurred over a five year time frame. Remember these currencies have been a lot more volatile than most other assets.