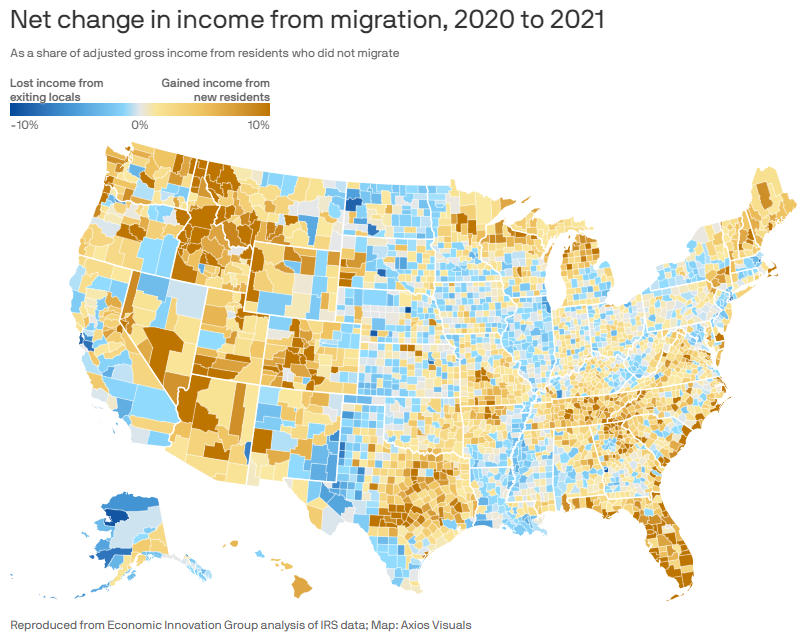
The chart of the week looks at the net change in income due to people moving from 2020 to 2021. I think we all “know” that this happened, but it is always great to have a chart to back it up. We saw an exodus from California, parts of the Midwest and parts of the northeast into the Southwest, Texas, Idaho and Florida, mainly Miami and the southeast coast. An interesting observation is the difference between West Texas and Central Texas. What will be even more interesting is to see what has happened more recently in 2023 and future years.