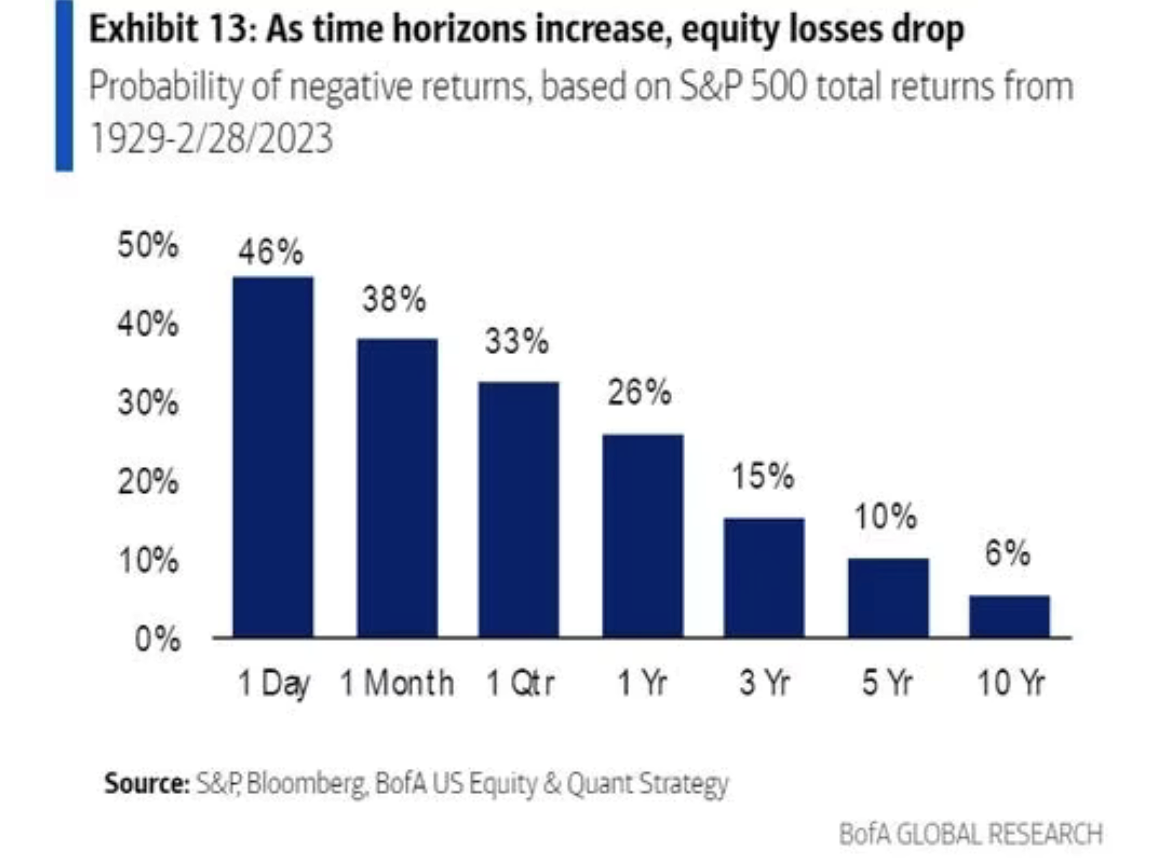
The chart of the week focuses on long-term returns, something we like to make sure is well understood by investors. This chart looks at the S&P 500 since 1929 and the probability of losing money over various time frames. On a one-day basis, you have historically had a 46% chance of losing money, which is basically a coin flip. But as is very clear on the chart, the longer your holding period, the lower probability you have of losing money. Over one month, the probability of losing money goes down to 38%. Over one year, you lost money only 26% of the time and over a five-year period, you only lost money 10% of the time! The current market has many investors believing it is tough to make money in stocks, but try your best to focus on the long-term and be sure to match your investments with your time frames.
The S&P 500 is comprised of approximately 500 widely held stocks that are generally considered representative of the U.S. stock market. It is unmanaged and cannot be invested into directly. Pas performance is no guarantee of future result.