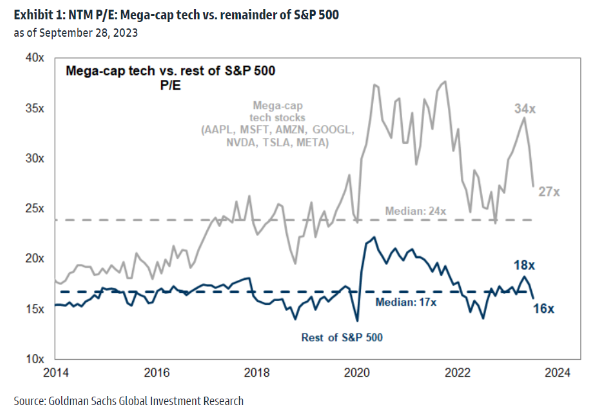
The chart of the week is similar to a past chart that looked at year-to-date returns of the “magnificent 7” compared to the other 493 companies in the S&P 500. This week’s chart looks at the forward price-to-earnings, or P/E ratio, of those same stocks which we look at to see how attractively valued they are. As you can see, the rest of the S&P 500 is currently trading at a much lower valuation of 16x earnings versus 27x earnings for the magnificent 7. We will be closely tracking both the performance of these two subsets as well as upcoming earnings season for the two.