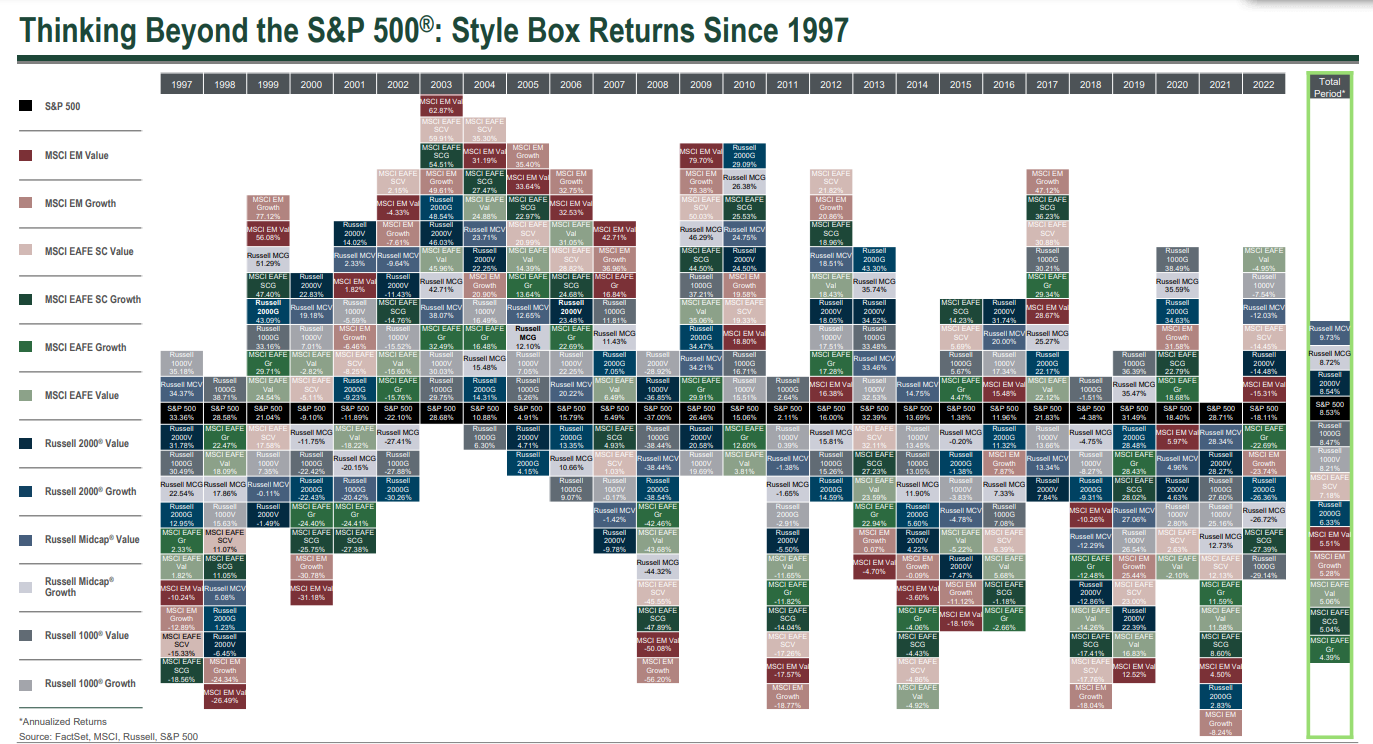
The chart of the week looks at various asset classes or “style boxes” for the stock market and their performance in relation to the S&P 500. There are many great takeaways from this chart. First, on the far right, since 1997 the S&P 500 has averaged about 8.53% a year, which was beat by three asset classes. Second, from 2001-2007, over 50% of the asset classes beat the S&P 500 and in 2003 every single asset class beat the index. Third, in 2021 the S&P 500 beat every single asset class. The main takeaway from this chart is that markets change and cycles happen. Once you know your goals for your investment funds, be prepared to understand the markets and how you should invest to meet those goals.