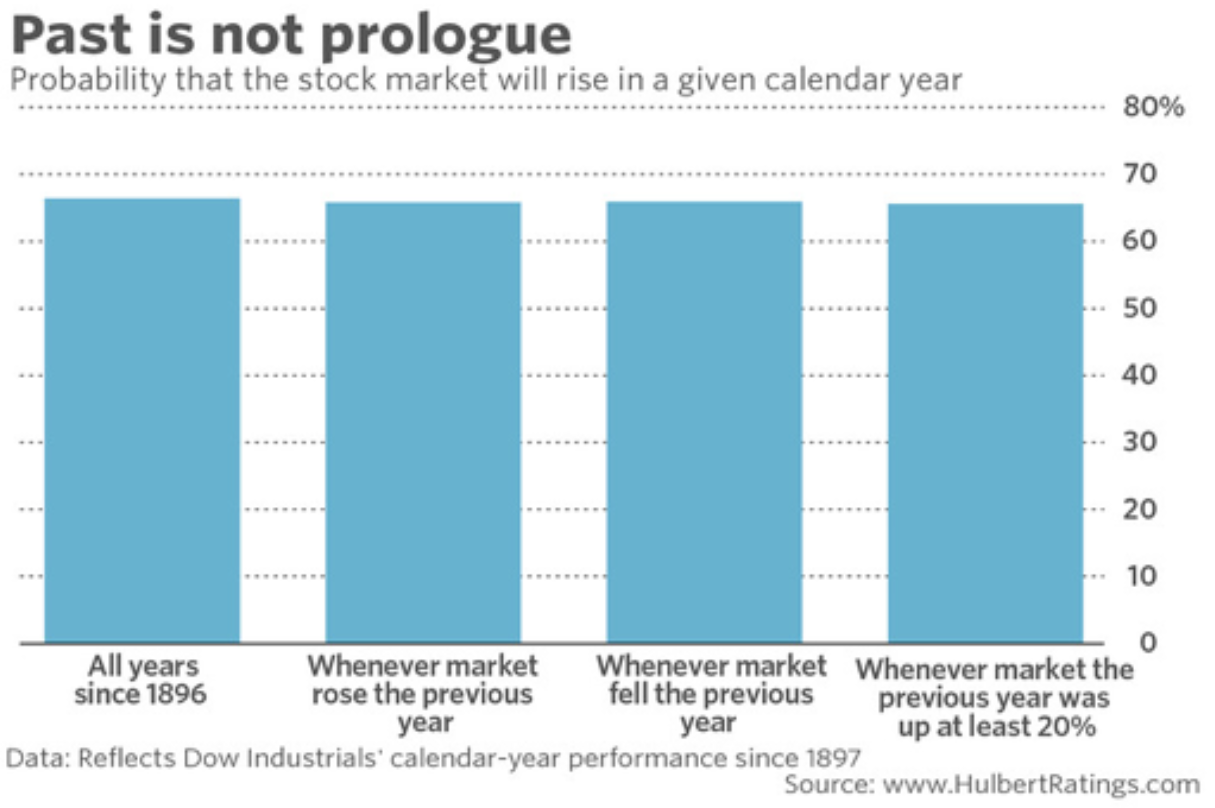
The chart of the week looks at past returns for the Dow Jones Industrial Average since 1896! The first bar on the left represents that the index was positive for a calendar year about 65% of the time. The second bar shows that the following calendar years when the index was positive, it was positive again about 65% of the time. The third bar shows when the index was negative the year before, about 65% of the time it was positive the following year. The last bar on the right shows that following a year when the index was up over 20%, you guessed it, about 65% of the time the index was positive. Long story short, a lot of things matter when it comes to market performance including valuation, business cycles, interest rates, amongst many other but over the long term the market hasn’t really cared about past returns.