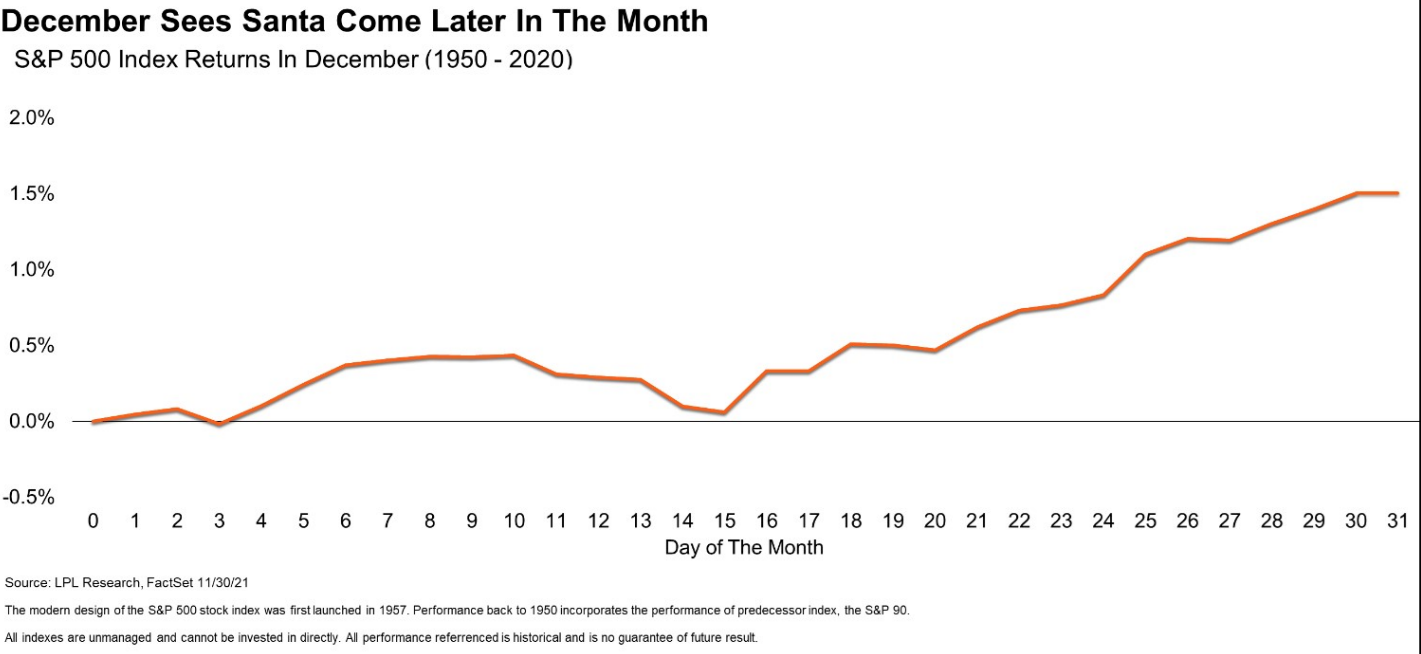
 The chart of the week looks at the historical performance of the S&P 500 in December. As you can see, historically speaking, the S&P has been about flat halfway through the month and then has taken off as we near Christmas. Some have coined this the “Santa Claus Rally”. Fingers crossed that we get some strong performance going into 2022.