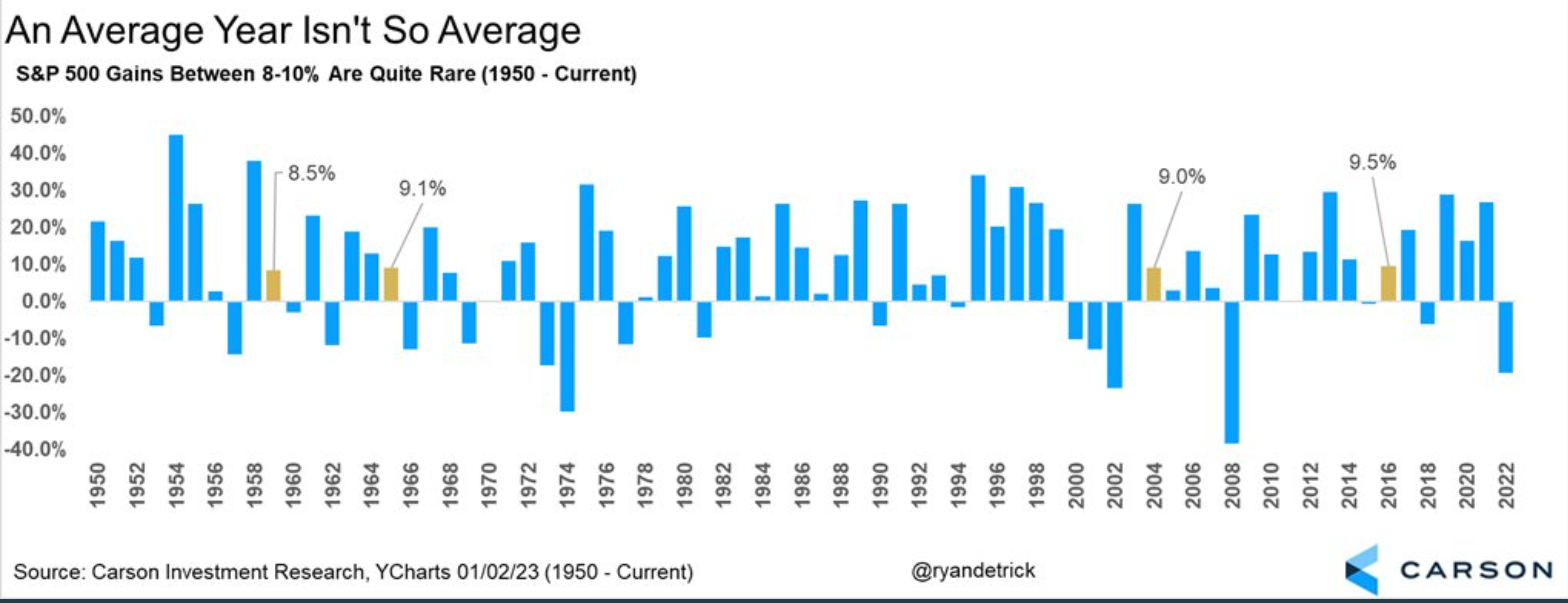
The chart of the week looks at annual returns for the S&P 500 since 1950. During this time, the average annual return was 9.1%. What is interesting, as the chart shows, is that it is very rare for stocks to actually have an annual return close to 9.1%. Oddly enough, only 4 times in that 72-year time span did the S&P 500 have a return in the 8-10% range. This serves as a good depiction of the volatility of the markets and a reminder of where an expected return of 8-10% historically has come from (hint: not years that return 8-10%).