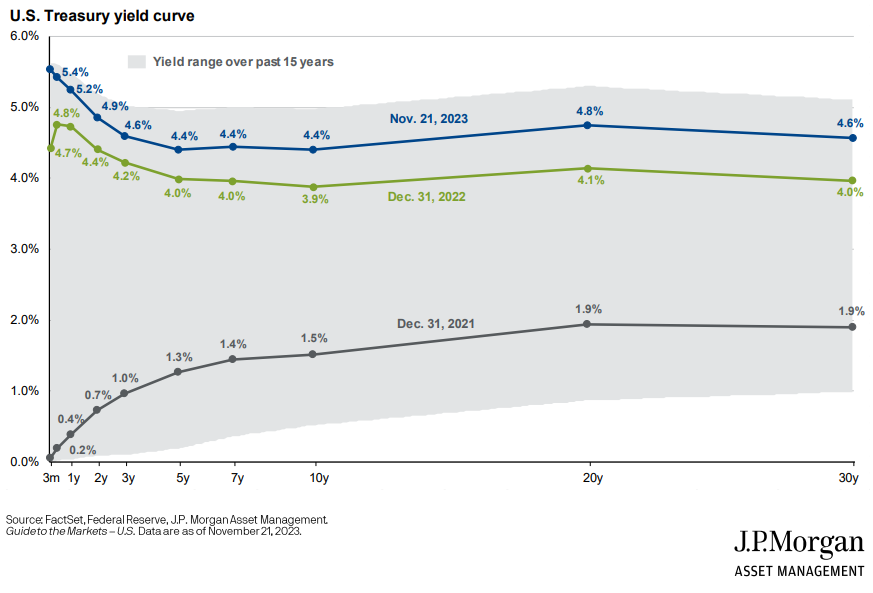
The chart of the week is a previous chart that looks at the US Treasury yield curve from 3 months to 30 years. The top blue line is as of November 21 and the green line shows it as of year-end 2022. Finally, the bottom grey line is as of year-end 2021 and shows a more normal shape of a yield curve. We saw an incredible move in rates during 2022 and that continued into 2023, while at a slower rate. As we move closer to 2024, investors will be focusing on if short-term rates come back down with Fed rate cuts and how the longer end of the curve reacts.