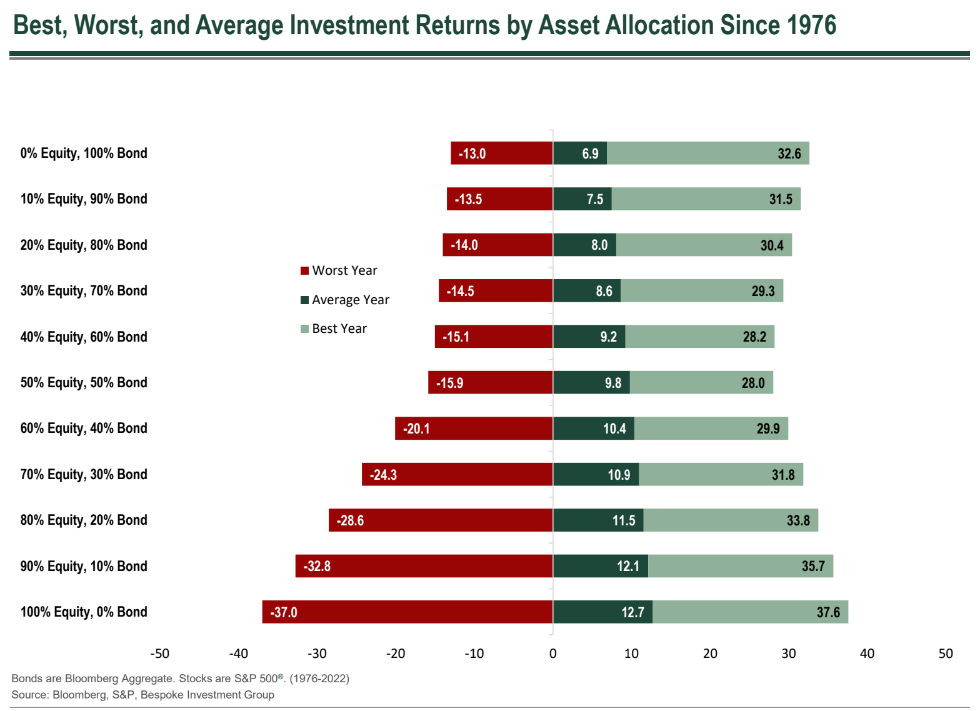
The chart of the week looks at the worst, the best and the average investment performance for various portfolios from 1976-2022. Stocks are the S&P 500 and bonds are the Bloomberg Aggregate Bond Index. Three things jumped out on this chart. First, the worst year ever for an all bond portfolio was 2022, which is very fresh in our minds. A return of -13% is definitely not the norm historically, but was brought on by very low starting interest rates and a very quick hiking cycle. Second, the average year for all portfolios was not only positive, but the worst performing portfolio still averaged 6.9% a year over that time frame. And lastly, over the 1976-2022 period, risk was rewarded. Each additional increment of 10% invested stocks, increased your average return with an all stock portfolio averaging 12.7% a year.