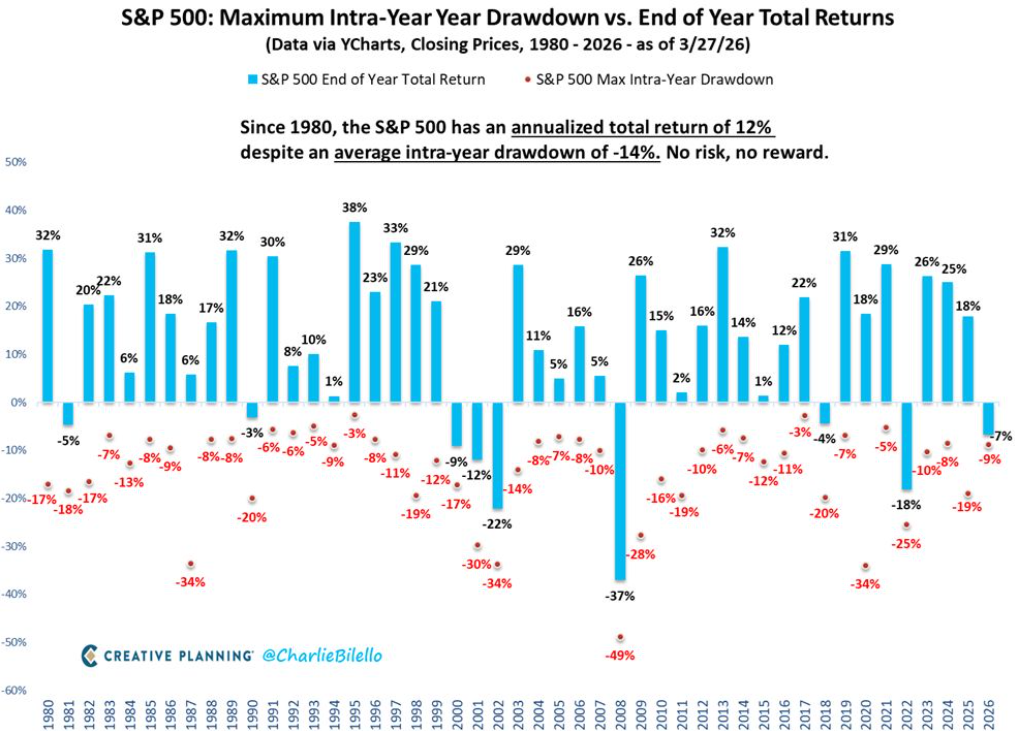
The chart of the week illustrates the relationship between the S&P 500’s maximum intra-year drawdowns and its full-year total returns from 1980 through early 2026. It is a great reminder that even in years with strong positive returns, the market often experiences significant declines along the way. On average, the index has delivered about 12% annually despite suffering an average intra-year drop of roughly 14%. This highlights the persistent volatility investors must experience to achieve long-term gains. Several years, such as 2009 and 2020, stand out with extreme drawdowns, yet subsequent recoveries and positive calendar year performance reinforce the resilience of the market. Notably, many years with double-digit positive returns still included drawdowns of 5–15%, underscoring that pullbacks are normal. Overall, the chart reinforces the principle that enduring volatility is a fundamental part of long-term investing success.