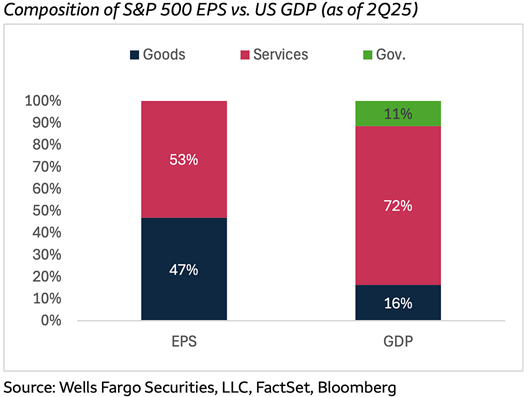
This week’s chart compares the makeup of S&P 500 earnings per share (EPS) with U.S. gross domestic product (GDP). The U.S. economy is predominantly services-oriented, representing over 70% of GDP, but S&P 500 earnings are almost evenly split between services and goods/manufacturing. Given the barrage of negative headlines and dramatic policy changes thus far in 2025, many are surprised to see yet another double-digit gain for large-cap U.S. equities as we round out the first three quarters of this calendar year. A good reminder that while the U.S. stock market and the U.S. economy are closely intertwined, they’re not necessarily the same.