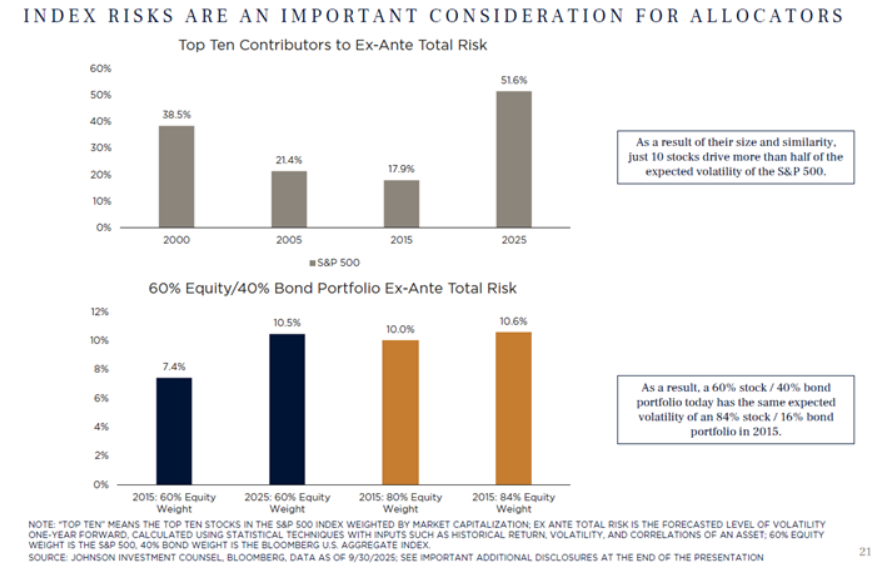
The chart of the week touches on a hot topic right now, concentration risk within the S&P 500, and how it has increased over time. In 2000, the top ten stocks contributed about 38.5% of total risk for the index before dropping to 17.9% in 2015. With the recent rise in concentration, risk related to the top ten stocks has hit 51.6% of the entire index. The growing dominance of large companies, and thus less of an allocation to the other companies, means a smaller number of stocks now drive most of the index’s volatility. The lower graph highlights something even more alarming.: Even in a balanced portfolio, a 60% equity and 40% bond portfolio, this portfolio in 2025 carries the same expected volatility as an 84% equity portfolio did in 2015. Overall, the data emphasizes how rising concentration has made diversified portfolios riskier than in past decades.