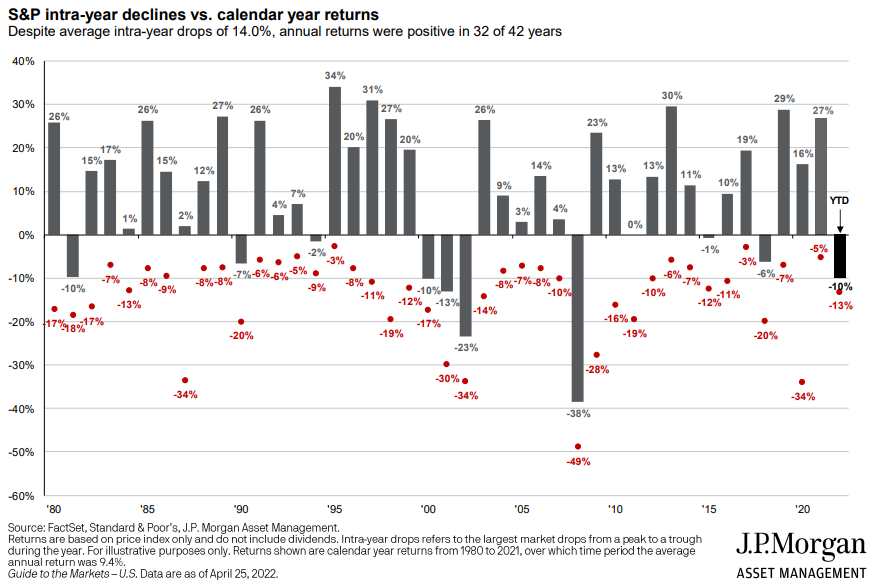
The chart of the week looks at calendar year returns for the S&P 500 dating back to 1980. The gray bar shows the price return of the index for the year and the red dot shows the intra-year drop in the index. As you can see, despite yearly drops that averaged 14%, annual returns were positive in 32 out of 42 years. Through April 25, the index had an intra-year drop of 13%. Since 1980, 17 full calendar years had intra-year drops of 13% or more and 9 of those years ended up with a positive calendar year return.