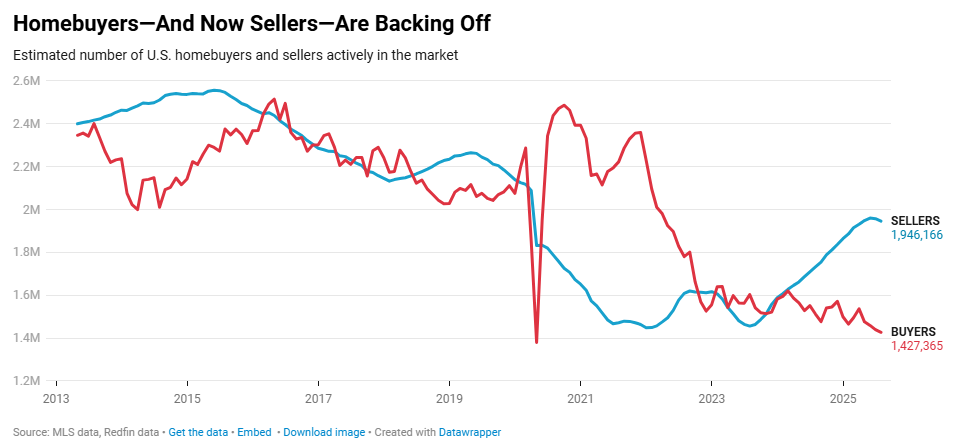
The chart of the week highlights a significant shift in the housing market since the COVID-19 pandemic. During the pandemic, buyer activity surged while the number of sellers remained low. However, the situation has now reversed. Currently, buyer demand has dropped to just 1.4 million, while the number of sellers has risen to nearly 2 million. For the first time in years, sellers outnumber buyers by over half a million, reshaping the market’s dynamics. This imbalance indicates weaker demand, increased supply, and more leverage for buyers who are still active in the market. With 30-year mortgage rates recently falling below 6.5%, the next movement in rates will be crucial in determining whether this gap widens or begins to close. It will be interesting to see at what rate buyers fully re-enter the market.